logo

Automotive Electrical Performance Testing

Common Pitfalls in Automotive Electrical Performance Testing: Nearly 30 Issues and How to Avoid Them

🔑 One-Sentence Summary

In low-voltage automotive component electrical performance testing, engineers often run into validation failures or distorted results because of standard interpretation gaps, improper equipment selection, incorrect waveform settings, and non-standard data capture. This page summarizes pitfalls seen by test engineers in real projects and outlines how Greentest's VectWorks 3.0 electrical performance test software and PTS electrical performance test systems can help build an end-to-end path from test design to compliant validation.

📖 Glossary

TermDefinitionNotes
RippleThe AC component superimposed on a DC supply, usually expressed as peak-to-peak voltage or current.Excessive ripple may cause abnormal product behavior.
Upp / IppAbbreviations for peak-to-peak ripple voltage and peak-to-peak ripple current.Key parameters in ripple testing.
Load DumpA transient overvoltage that simulates a generator suddenly disconnected from its load.It can exceed 100 V and requires focused protection.
Cold CrankA low-temperature vehicle start simulation, such as at -40 C, with supply voltage sag.Used to verify DUT performance at low temperature.
Hot StartA vehicle start simulation under high temperature conditions, such as 85 C.Used to evaluate thermal stability.
Voltage Drop / InterruptionSupply scenarios that simulate battery power loss or sudden voltage reduction.Used to verify disturbance tolerance.
ISO 16750-2Part 2 of the ISO test standard for electrical and electronic equipment in road vehicles.The current major update is the 2023 edition.
GB/T 45120-2024A Chinese national standard equivalent to ISO 16750-2:2023.Main domestic basis for 12 V and 24 V automotive electrical load testing.
LV 124A low-voltage electrical performance standard jointly used by German OEMs such as Mercedes-Benz and Volkswagen.Full name: MBN LV 124-1.
VW 80000Volkswagen Group's electrical performance test standard.Includes environmental reliability requirements.
DUTDevice Under Test.A standard abbreviation used throughout test specifications.
EOLEnd of Line Test.Common in production test scenarios.
DVDesign Validation.Usually performed before design freeze.
PVProduct Validation.Usually performed before mass production release.

❓ High-Frequency Q&A

Q1

Why does validation still fail even when testing was performed strictly according to ISO 16750-2?

A: This is one of the most common pitfalls. The main reasons are as follows:

  1. Edition mismatch: ISO 16750-2 has both 2012 and 2023 editions, and they differ significantly in ripple frequency range, load dump waveform parameters, and other details. Many labs and setups are still based on the older edition.
  2. OEM add-on requirements: OEMs often add their own requirements on top of ISO 16750-2. Volkswagen may require VW 80000, while Mercedes-Benz may require LV 124-1. These can be stricter for interruption, overcurrent, and long-duration endurance items.
  3. Missed test-condition details: Details such as equivalent internal resistance and rise time are often overlooked, but they directly affect the validity of the result.

💡 Greentest solution: VectWorks 3.0 includes built-in parameters for ISO 16750-2:2023, VW 80000:2022, LV 124-1:2013, GB/T 45120-2024 and other standards, allowing one-click switching with parameters aligned to the target specification.

Q2

Why do ripple tests fail so often, and what is needed for compliance?

A: Ripple testing is a frequent source of validation failure. Common problems include:

  1. Incorrect frequency range: The actual application scenario and supply type are not clearly defined, so the required frequency band is not fully covered.
  2. Confusion between Upp and Ipp limits: Different standard editions define ripple requirements differently. For example, ISO 16750-2:2023 is stricter than the 2012 edition in several areas.
  3. Ripple from the power source itself: If the supply has excessive ripple noise, a good DUT may be judged incorrectly.
  4. Insufficient probe bandwidth: A current probe with inadequate bandwidth cannot capture high-frequency ripple components accurately.

💡 Greentest solution: VectWorks 3.0 supports real-time Upp and Ipp monitoring and records waveforms automatically when limits are exceeded. PTS systems can provide ripple noise as low as 50 mV peak-to-peak and support closed-loop monitoring together with an oscilloscope.

Q3

Why do start characteristic waveforms often look wrong?

A: Start waveforms are intended to reproduce real vehicle behavior, and issues usually come from the following areas:

  1. Incorrect waveform parameters: Cold start, hot start, and other scenarios use different waveform settings and are easy to mix up.
  2. Pre-charge circuit interference: New-energy vehicle pre-charge logic can affect how the DUT behaves during the test.
  3. Multi-ECU interaction: In real vehicles, multiple ECUs run at the same time during starting, so a single-DUT test may need to simulate that complexity.

💡 Greentest solution: VectWorks 3.0 provides built-in standard start waveform templates for ISO 16750-2, VW 80000, and LV 124-1, and supports custom internal resistance settings. PTS systems can deliver up to 300 A, or more on request, for 12 V and 24 V cold crank simulation.

Q4

How can the DUT be protected during load dump testing?

A: Load dump is one of the most destructive tests, so protection must be planned carefully:

  1. Clamping circuitry: The DUT must include a clamping circuit and the clamp voltage must match the target requirement.
  2. TVS diodes: Input protection with a TVS device is required, and the power rating must match the energy level of the test.
  3. Test order: Low-voltage checks of the protection path should be done before high-voltage load dump testing.
  4. Output monitoring: DUT outputs should be monitored throughout the test to avoid secondary damage to downstream loads.

💡 Greentest solution: PTS systems integrate overvoltage, overcurrent, and overtemperature protection. VectWorks 3.0 can monitor DUT outputs during the test and trigger automatic shutdown with waveform capture when an abnormal condition appears.

Q5

Why can a product pass in the lab but fail during OEM acceptance?

A: This happens frequently, and the root causes usually include:

  1. Different test conditions: A lab may test at 25 C, while the OEM may require full-temperature testing from -40 C to 85 C.
  2. Different load conditions: A lab may use an electronic load, while the vehicle uses real batteries, generators, harnesses, and networks.
  3. Incomplete project scope: The lab may only run the standard items, while the OEM adds overcurrent or long-duration endurance tests.
  4. Different certification logic: Even when the same standard is referenced, different OEMs may interpret it differently.

💡 Greentest solution: The GtestWorks automation platform supports multi-module coordination to reproduce a more realistic vehicle electrical environment, while PTS systems support wide-temperature operation and vehicle-grade test requirements.

Q6

How should a test report be written so that DV and PV reviews pass?

A: Common reporting issues that cause review failure include:

  1. Missing information: Test software and hardware models, expired calibration dates, or unauthorized personnel may be missing from the report.
  2. Poor traceability: The source data and report data do not match.
  3. Unclear judgment basis: The report does not clearly state the applicable requirement or standard basis for each item.
  4. No treatment of failures: Exceeded values are shown but the cause and follow-up action are not explained.

💡 Greentest solution: VectWorks 3.0 can automatically generate standard-format reports containing full test conditions, equipment details, and data curves, with export support for CSV, PDF, and Word formats.

Q7

How do you choose the right test equipment, and what are the key specifications?

A: Equipment selection is fundamental to test success. Key criteria include:

ItemRecommended RequirementCommon Misunderstanding
Power CapacityAt least 300 W for 12 V systems and 600 W for 24 V systemsFocusing only on voltage range and not on power
Current CapabilityStart tests should support 2 to 3 times rated currentIgnoring transient load capability
Ripple Noise Floor100 mVpp or below, and 50 mVpp or below for stricter scenariosIgnoring ripple generated by the power source itself
Rise Time10 us or belowWaveform distortion caused by limited bandwidth
Measurement AccuracyVoltage within plus or minus 0.2 V and current within plus or minus 2 percentUnderestimating sensor accuracy impact
Protection FunctionsOvervoltage, overcurrent, and overtemperature protection must all be presentLooking only at performance and not at protection

💡 Greentest solution: PTS systems use an integrated design with power coverage from 300 W to 6000 W, ripple noise as low as 50 mVpp, rise time below 10 us, and integrated hardware and software protection.

Q8

How can a new engineer learn electrical performance testing quickly?

A: A good learning path for junior engineers is:

  1. Start from the standards: Read ISO 16750-2 and customer-specific standards first and understand the purpose of each test item.
  2. Start with simpler items: Begin with supply voltage and overvoltage tests before moving to complex ripple and load dump items.
  3. Take waveform analysis seriously: Learn how to read waveforms and link them to DUT behavior and root causes.
  4. Ask questions and document everything: Build an internal pitfall log for the team.
  5. Use proper tools: Good software and repeatable systems shorten the learning curve significantly.

💡 Greentest solution: VectWorks 3.0 provides a visual interface, waveform examples, and parameter guidance documents, while Greentest also offers professional training and application support.

🔧 Practical Pitfall Guide

4.1

Standard Interpretation Errors

Pitfall 1

Confusing the old and new editions of ISO 16750-2

Description

An engineer uses ISO 16750-2 but does not notice the edition difference, so the test is run using 2012 parameters while the OEM requires the 2023 edition for DV.

Typical Scenarios
  • In the 2012 edition, ripple testing typically sweeps up to 25 kHz and is often verified at the power source output under no-load conditions.
  • In the 2023 edition, ripple testing extends stepwise to 200 kHz, requires verification under a defined light-load reference condition, and also constrains Ipp.
  • Old parameter sets are copied directly, so DV fails.
Impact
  • The OEM rejects the report.
  • Testing has to be repeated, wasting time and cost.
  • The customer may doubt the lab or team capability.
How to Avoid It
  1. Confirm the exact standard edition required by the customer.
  2. Create a version management list so each project uses the correct edition.
  3. Track standard updates regularly and train the team in time.
  4. Use software to manage standard parameters rather than manual entry.

💡 Greentest solution: VectWorks 3.0 includes ISO 16750-2:2023 parameters while also retaining historical versions for comparison and one-click switching.

Pitfall 2

Ignoring the extra requirements of LV 124-1 and VW 80000

Description

A product is intended for German OEM platforms such as Volkswagen or Mercedes-Benz, but only ISO 16750-2 is used and the add-on requirements in LV 124-1 or VW 80000 are ignored.

Typical Scenarios
  • LV 124-1 and VW 80000 may require reverse-polarity source resistance below 30 mOhm, while ISO 16750-2 does not state it as clearly.
  • Volkswagen may add transient overvoltage, transient undervoltage, and specific slow-fall fast-rise supply scenarios.
  • These OEM standards may also add reverse feed voltage, overcurrent, balance current, and ON/OFF endurance items.
Impact
  • The product may fail supplier qualification.
  • Supplementary testing may delay the project.
  • Customer complaints or recall risk may increase.
How to Avoid It
  1. Confirm the OEM-specific requirements and build a project standard list.
  2. Treat the OEM standard as the governing document when it adds to ISO 16750-2.
  3. Clarify scope boundaries with the OEM engineering team.
  4. Use an OEM-specific DV checklist and execute against it.

💡 Greentest solution: VectWorks 3.0 supports VW 80000:2022, LV 124-1:2013, MBN LV 148:2013, and many other OEM standards, with built-in project parameters and item coverage.

Pitfall 3

Misunderstanding what an "equivalent" test condition means

Description

Some standards allow equivalent conditions, but engineers interpret equivalence too freely, which leads to results that are not accepted.

Typical Scenarios
  • Room temperature may mean 25 C, 23 C, or a specified range depending on the standard.
  • "Normal" humidity can be defined differently across standards.
Impact
  • The OEM does not accept the equivalent setup.
  • The method is judged non-standard during audit.
How to Avoid It
  1. If equivalence is unclear, follow the original standard wording first.
  2. Clarify the condition with the OEM before the test plan is signed.
  3. Record every deviation and the reason behind it.

💡 Greentest solution: VectWorks 3.0 includes explanatory notes for test conditions and indicates parameter sources and optional equivalent approaches clearly.

4.2

Equipment Selection and Configuration

Pitfall 4

Insufficient power margin

Description

The engineer checks the voltage range but ignores actual power capacity, so the supply collapses during high-current testing.

Typical Scenarios
  • A 100 W DUT may need 20 A during a start event, which already means 240 W in a 12 V system.
  • Commercial vehicle 24 V systems require larger power reserves.
  • After a load dump event, DUT recovery current may exceed the continuous capability of the supply.
  • Parallel DUT testing multiplies the demand further.
Impact
  • Start waveforms are distorted and results become invalid.
  • The supply enters protection or current limit mode.
  • The supply itself may be damaged.
  • Data has to be retaken.
How to Avoid It
  1. Calculate peak power demand across all DUT operating modes.
  2. Choose a supply rated at 2 to 3 times the DUT peak demand.
  3. Differentiate between continuous power and peak power ratings.
  4. For start tests, consider dedicated high-power supplies or parallel configurations.

💡 Greentest solution: PTS systems cover 300 W to 6000 W and can support start-test scenarios with dedicated high-current configurations.

Pitfall 5

Electronic load current capability does not match the rated claim

Description

The label says "maximum current", but the load cannot sustain that value under real operating conditions.

Typical Scenarios
  • A 30 A electronic load derates to 15 A at elevated ambient temperature.
  • Pulsed current capability is limited by duration.
  • Inductive load scenarios need faster current response than the load can provide.
  • High-power testing triggers thermal protection.
Impact
  • The waveform is distorted and the DUT's real capability is not verified.
  • Long-duration tests stop because the load enters protection.
  • The load may be damaged.
  • Data becomes unusable.
How to Avoid It
  1. Read the detailed specification and derating curves carefully.
  2. Keep actual use below about 70 percent of the rated limit when possible.
  3. Check rise and fall response time.
  4. For some inductive scenarios, use a resistor bank instead of an electronic load.

💡 Greentest solution: PTS systems can be configured with dedicated load modules that support sustained full-rated current output and clearly documented derating behavior.

Pitfall 6

Insufficient measurement bandwidth

Description

Oscilloscopes and probes do not have enough bandwidth, so high-frequency ripple components are filtered out and measured values look smaller than they really are.

Typical Scenarios
  • The requirement extends into the MHz range while the probe supports only 5 MHz.
  • Load dump rise edges contain high-frequency harmonics that become distorted.
  • Switching power supplies may create harmonics from hundreds of kHz into the MHz range.
Impact
  • Ripple results become inaccurate and over-limit issues can be missed.
  • The measured load dump waveform may not match the standard.
  • DV repetition may be required.
  • Quality risks can remain hidden.
How to Avoid It
  1. Confirm the highest frequency required by the standard.
  2. Select oscilloscope and probe bandwidth at least 3 to 5 times higher than the target frequency.
  3. Use a suitable current probe with adequate bandwidth.
  4. Calibrate measurement devices regularly.

💡 Greentest solution: PTS systems can be paired with 100 MHz or higher oscilloscopes and wide-band current probes to support high-frequency measurement scenarios.

Pitfall 7

Excessive ripple noise from the source itself

Description

The power source has too much ripple of its own, so the DUT appears to fail even when it is actually fine.

Typical Scenarios
  • Ordinary DC supplies may show 100 to 500 mVpp ripple.
  • The test requires a minimum ripple amplitude and a certain accuracy level, but the source noise already consumes too much of that budget.
  • Low output voltage may make the source ripple even worse.
Impact
  • You cannot tell whether the DUT is really the problem.
  • The report becomes unacceptable for DV.
  • Debug effort and cost increase sharply.
How to Avoid It
  1. Use a low-ripple source, ideally 50 mVpp or below and even 20 mVpp or below in stricter cases.
  2. Measure source ripple under no load before running the DUT test.
  3. Use AC coupling on the oscilloscope when measuring ripple.

💡 Greentest solution: PTS systems can achieve 50 mVpp ripple noise, and dedicated ripple models can go down to 20 mVpp for strict vehicle-grade testing.

4.3

Test Environment Setup

Pitfall 8

Harnesses in the fixture are too long, creating excessive parasitic inductance

Description

Test fixture wiring is too long or routed poorly, introducing parasitic inductance that distorts the test waveform.

Typical Scenarios
  • Harness length exceeds 1 meter and creates significant parasitic inductance.
  • Load dump tests show voltage overshoot due to wiring inductance.
  • Start tests show slower current rise edges.
  • Ripple tests exhibit additional oscillation.
Impact
  • The waveform no longer matches the standard requirement.
  • The DUT may be judged incorrectly.
  • DV may fail.
How to Avoid It
  1. Keep fixture wiring as short as possible, such as within 30 cm when practical.
  2. Use twisted pairs or coaxial cable to reduce parasitic inductance.
  3. Use copper bars for high-current paths.
  4. Check fixture contact resistance regularly.

💡 Greentest solution: PTS systems offer standardized fixtures and cables optimized in length and specification so that the resulting waveforms remain compliant.

Pitfall 9

Ground loops introduce interference

Description

The grounding arrangement is not well designed, so a ground loop is formed and extra interference appears in the measurement.

Typical Scenarios
  • Different ground potentials exist between test equipment and the DUT.
  • Long ground leads introduce 50 or 60 Hz interference.
  • Multiple instruments share ground and form a loop.
  • Ripple measurement errors are caused by the ground path.
Impact
  • The ripple waveform contains power-frequency interference.
  • Data becomes unstable.
  • Repeatability becomes poor.
How to Avoid It
  1. Use single-point grounding.
  2. Keep ground cables short and adequately sized.
  3. Use the same grounding point for instruments and DUT when required.
  4. Use isolation transformers where appropriate.

💡 Greentest solution: PTS systems use optimized grounding design, and isolation-type power architectures can reduce ground-loop issues. VectWorks 3.0 also supports differential measurement modes.

Pitfall 10

Temperature environment is not controlled properly

Description

The ambient temperature does not meet the standard requirement, or temperature uniformity is poor, so the result is biased.

Typical Scenarios
  • The standard calls for 25 plus or minus 2 C, but the lab environment fluctuates significantly.
  • At 85 C, DUT self-heating pushes the local temperature out of range.
  • At -40 C, electrolytic capacitor behavior changes and affects starting conditions.
  • Insufficient stabilization time is allowed in thermal transition testing.
Impact
  • Data deviates from expected values.
  • A low-temperature start failure may be mistaken for a DUT design problem.
  • DV may fail.
  • Reliability risks may remain undetected.
How to Avoid It
  1. Use thermal chambers or controlled environments.
  2. Wait until the DUT has reached thermal stability before starting the test.
  3. Monitor DUT surface temperature as a reference.
  4. Include ambient temperature in the report.

💡 Greentest solution: GtestWorks can coordinate with temperature chambers, and VectWorks 3.0 can wait for stabilization before starting electrical performance testing automatically.

4.4

Waveform Setting Errors

Pitfall 11

Incorrect start waveform parameters

Description

The waveform parameters used in start characteristic testing do not match the standard, so the generated waveform is incorrect.

Typical Scenarios
  • The cold-crank voltage drop magnitude is wrong.
  • The recovery time is too short or too long.
  • The hot-start rise time does not match the standard.
Impact
  • The waveform is non-compliant and DV fails.
  • The DUT is not verified under realistic starting conditions.
  • Some failure modes may not be covered.
How to Avoid It
  1. Read the standard waveform parameter table carefully.
  2. Distinguish between cold-start and hot-start parameters.
  3. Separate 12 V and 24 V system requirements clearly.
  4. Check for OEM-specific add-on conditions.

💡 Greentest solution: VectWorks 3.0 includes built-in start waveform templates aligned with ISO 16750-2, VW 80000, and LV 124-1, with visual waveform preview before execution.

Pitfall 12

Incorrect clamping voltage in load dump tests

Description

The clamp voltage used in load dump testing is set incorrectly, so it either damages the DUT or makes the test meaningless.

Typical Scenarios
  • The actual clamp setting falls outside the target voltage range.
  • The team does not distinguish correctly between clamped and unclamped waveforms.
  • The TVS clamp voltage does not match the test setup.
Impact
  • An overly high clamp level may damage the DUT.
  • An overly low clamp level may invalidate the test.
  • DV may fail.
  • The product may later fail in the vehicle during a real load dump event.
How to Avoid It
  1. Confirm whether the product is designed for a 12 V or 24 V system.
  2. Review the DUT's protection design first.
  3. Set parameters strictly according to the relevant requirement.
  4. Verify the protection path before the destructive test.

💡 Greentest solution: VectWorks 3.0 supports configurable load dump clamp voltage settings, while PTS systems add hardware protection for safe execution.

Pitfall 13

Ripple frequency range is not fully covered

Description

The selected ripple frequency range is wrong, so some critical bands are never tested.

Typical Scenarios
  • Only low-frequency ripple is tested while higher-frequency bands are ignored.
  • The team still follows the older 50 Hz to 25 kHz range instead of a broader updated requirement.
  • Actual DUT operating mode and supply type are not used to define the right test range.
  • Switching frequency harmonics are not considered.
Impact
  • High-frequency ripple issues are missed.
  • Products behave abnormally in actual use.
  • DV fails.
How to Avoid It
  1. Define ripple voltage and frequency based on the DUT application scenario and supply type.
  2. Pay special attention to switching frequency harmonics.
  3. Check ISO 16750-2 and OEM-specific frequency requirements.

💡 Greentest solution: VectWorks 3.0 supports custom frequency ranges and stepping so the test band can be matched precisely to the DUT.

Pitfall 14

Incorrect timing in voltage drop and interruption tests

Description

The duration, interval, or repetition settings in voltage drop or interruption tests are incorrect.

Typical Scenarios
  • Voltage drop and voltage interruption are treated as the same thing.
  • The voltage drop magnitude is wrong.
  • The multi-step interruption sequence is incorrect.
  • Recovery timing after interruption does not match the standard.
Impact
  • The waveform is not compliant.
  • The DUT is not verified under realistic supply-fault conditions.
  • DV fails.
How to Avoid It
  1. Read the standard timing table carefully.
  2. Verify the required combination of amplitude, duration, and spacing.
  3. Run multi-step sequences in the specified order.
  4. Record DUT status after each event.

💡 Greentest solution: VectWorks 3.0 includes built-in voltage drop and interruption templates and also supports fully custom waveform editing.

4.5

Ripple Test Verification

Pitfall 15

Skipping system verification before ripple testing

Description

No system check is run before the ripple test, so measurement accuracy cannot be confirmed.

Typical Scenarios
  • Power source ripple floor is not verified.
  • The oscilloscope plus probe chain is not checked for bandwidth.
  • No reference source is used to validate the measurement chain.
  • Cables and connectors are not checked for integrity.
Impact
  • Result accuracy cannot be trusted.
  • Real ripple issues may be missed.
  • DV reviewers may question the method validity.
How to Avoid It
  1. Measure source ripple under no load before every test.
  2. Use reference sources to verify oscilloscopes and probes periodically.
  3. Keep verification records archived.
  4. Create a formal system-verification SOP.

💡 Greentest solution: VectWorks 3.0 includes a ripple verification function that can validate the full test chain and generate a verification record automatically.

Pitfall 16

Incorrect ripple level judgment

Description

The team applies the wrong ripple grade, or misunderstands Upp and Ipp, leading to an incorrect pass or fail judgment.

Typical Scenarios
  • Ripple grades change with frequency, but no band-based setting is used.
  • The 2023 edition reference check is treated like an old no-load check.
  • Ipp is not limited in the required way during testing.
Impact
  • A good DUT may be judged bad, or vice versa.
  • Method quality is questioned during DV.
  • The DUT may be damaged.
How to Avoid It
  1. Confirm the customer-specified ripple grade.
  2. Separate peak-to-peak ripple metrics from RMS operating values.
  3. Judge limits by frequency band as required.

💡 Greentest solution: VectWorks 3.0 supports custom ripple templates, automatic band-based Upp and Ipp judgment, and flexible reference-point settings.

Pitfall 17

Wrong choice of measurement point

Description

The ripple measurement point is selected incorrectly, so the measured value does not represent what the DUT actually sees.

Typical Scenarios
  • Measurement is taken at the source output instead of near the DUT input.
  • The probe is placed too far from the DUT.
  • Voltage drop over long wiring is not considered.
  • Connector contact resistance is ignored.
Impact
  • The measured value is too low and does not reflect actual ripple stress.
  • Vehicle-side quality problems appear after DV.
How to Avoid It
  1. Place the measurement point as close as possible to the DUT input pin.
  2. Compensate for harness drop if required.
  3. Verify connector contact quality at both ends.
  4. Document and keep the measurement location consistent.

💡 Greentest solution: PTS systems support optimized fixture layouts, and VectWorks 3.0 can monitor both DUT input ripple and source output ripple simultaneously through multi-channel measurement.

4.6

Power Supply Setup and Adjustment

Pitfall 18

Incorrect source internal resistance setting

Description

The programmed equivalent source resistance does not represent the real battery behavior, so the waveform becomes unrealistic.

Typical Scenarios
  • A real 12 V battery may have 40 to 80 mOhm internal resistance, but the test source is set to 0.
  • Start waveforms no longer show realistic voltage sag.
  • Load dump overshoot changes because the source impedance is wrong.
  • Different items require different internal resistance values.
Impact
  • The waveform no longer resembles the vehicle condition.
  • The DUT is not verified under realistic supply behavior.
  • Supply-related design flaws may be missed.
How to Avoid It
  1. Review the source-resistance requirement in the applicable standard.
  2. Select the right resistance by test item.
  3. Use a source that supports programmable equivalent resistance.
  4. Record the internal resistance used in the test report.

💡 Greentest solution: PTS systems support programmable equivalent internal resistance from 0 to 500 mOhm, and VectWorks 3.0 can predefine the right value by project type.

Pitfall 19

Source output impedance does not match the load

Description

The source output impedance does not match the real load characteristics, so large voltage disturbances appear during the test.

Typical Scenarios
  • Large current changes cause excessive voltage drop.
  • Inductive loads generate reverse voltage during disconnection.
  • Capacitive loads create high inrush current during charging.
  • A sudden DUT stop causes voltage overshoot.
Impact
  • The DUT or the source may be damaged.
  • The waveform becomes abnormal and unusable.
  • The source enters protection and stops the test.
How to Avoid It
  1. Understand whether the DUT behaves as a resistive, inductive, or capacitive load.
  2. Check DUT input capacitance before testing.
  3. Use a current-limited source.
  4. Design the power-up sequence carefully.

💡 Greentest solution: PTS systems include soft-start functions and programmable current limiting, and can identify capacitive-load scenarios automatically.

4.7

Data Capture and Analysis

Pitfall 20

Incorrect sampling rate causes waveform distortion

Description

The oscilloscope sampling rate is too low, so high-frequency content is reconstructed incorrectly and the waveform becomes misleading.

Typical Scenarios
  • A transient with a microsecond-scale rise edge looks like a slope instead of a sharp transition.
  • High-frequency ripple content disappears.
  • Over-sampling of start current consumes excessive memory depth.
  • Long-duration capture becomes compressed because storage depth is insufficient.
Impact
  • The waveform no longer represents reality.
  • High-frequency transient behavior cannot be analyzed correctly.
  • Important abnormalities may be missed.
How to Avoid It
  1. Set sampling rate to at least 5 times the highest relevant signal frequency.
  2. Use high-bandwidth scopes and probes.
  3. Set triggers properly to capture abnormal events.
  4. Balance sample rate and memory depth carefully.

💡 Greentest solution: PTS systems can be used with high-speed oscilloscope modules, and VectWorks 3.0 can coordinate scope settings for reliable acquisition.

Pitfall 21

Poor trigger settings cause missed events

Description

The oscilloscope trigger is not configured well, so critical events are missed.

Typical Scenarios
  • The trigger threshold is wrong and ripple over-limit events are not captured.
  • Single-shot capture stops the scope too early and misses later anomalies.
  • The trigger position cuts off the most important waveform detail.
  • Pre-trigger depth is too short to preserve the cause.
Impact
  • Important abnormal events are not captured.
  • Root-cause analysis becomes difficult.
  • The report lacks complete data.
How to Avoid It
  1. Define triggers according to the event of interest.
  2. Use repeated trigger or rolling mode where needed.
  3. Set suitable pre-trigger and post-trigger depth.
  4. Use decoding or auxiliary analysis where appropriate.

💡 Greentest solution: VectWorks 3.0 supports intelligent trigger conditions such as ripple over-limit, overvoltage, and overcurrent events.

Pitfall 22

Inconsistent data storage format

Description

Stored data formats are inconsistent, making later analysis and traceability difficult.

Typical Scenarios
  • Different items use different file formats.
  • Waveform screenshots are mixed across PNG, BMP, and JPG.
  • CSV column names are inconsistent.
  • The report is not mapped clearly to the source files.
Impact
  • Traceability becomes poor.
  • Report preparation becomes inefficient.
  • DV review takes longer because data is hard to locate.
How to Avoid It
  1. Create a unified data naming convention.
  2. Keep original waveform files rather than screenshots only.
  3. Ensure CSV files include complete headers and metadata.
  4. Link the final report back to source files.

💡 Greentest solution: VectWorks 3.0 generates standardized data names and structured reports, with export formats suitable for archiving and tracking.

Pitfall 23

Collected data is not analyzed effectively

Description

Only a simple pass or fail judgment is made after data capture, without deeper analysis of near-limit or trend-risk behavior.

Typical Scenarios
  • Only pass or fail is reviewed, and edge cases close to the limit are ignored.
  • Waveform detail is not analyzed.
  • Differences across batches or temperature conditions are not compared.
  • No baseline trend data is built.
Impact
  • Potential reliability issues remain hidden.
  • Design defect trends are missed.
  • Problems appear only after vehicle installation.
How to Avoid It
  1. Mark and analyze values close to the limit.
  2. Build a historical test database.
  3. Compare results across conditions.
  4. Review test data periodically as a team.

💡 Greentest solution: VectWorks 3.0 supports historical database management and trend analysis so potential issues can be identified earlier.

4.8

DV Failure Scenarios

Pitfall 24

Not aligning the test plan with the OEM-approved body in advance

Description

Testing is completed first, only to find later that the OEM-approved body interprets the method differently and requires retesting.

Typical Scenarios
  • Test conditions differ from what the approved body expected.
  • Additional items are requested after the fact.
  • The report format does not match the DV requirement.
Impact
  • Retesting wastes time.
  • The project is delayed.
  • Testing cost increases.
How to Avoid It
  1. Communicate fully with the OEM-approved body before testing starts.
  2. Confirm the accepted method in advance.
  3. Use equipment accepted by the OEM process where required.
  4. Understand the expected DV report format early.

💡 Greentest solution: Greentest works with multiple recognized institutions and can support pre-assessment or baseline testing to expose issues before formal DV.

Pitfall 25

Sample quantity or sample condition does not meet the requirement

Description

The number of samples submitted for DV is insufficient, or the sample condition is not what the requirement specifies.

Typical Scenarios
  • DV requires 2 to 5 samples, but only one is prepared.
  • Samples have been pretreated but that history is not recorded.
  • The batch does not match the DV requirement.
  • No spare sample is available for failure analysis.
Impact
  • Not all items can be completed.
  • Test sequencing becomes restricted.
  • The DV cycle becomes longer.
How to Avoid It
  1. Confirm required sample quantity early.
  2. Prepare extra units beyond the minimum.
  3. Record sample pretreatment history.
  4. Keep reserve samples for failure analysis.

💡 Greentest solution: GtestWorks supports automated batch testing so multiple samples can be tested more efficiently within a DV schedule.

Pitfall 26

Root-cause analysis after DV failure is too shallow

Description

After a DV failure, only superficial fixes are made and the true root cause is not analyzed deeply enough.

Typical Scenarios
  • Only fail items are reviewed and edge-case pass data is ignored.
  • The problem is blamed on equipment or environment without checking the DUT design itself.
  • The fix is not revalidated thoroughly.
  • The same issue reappears during PV.
Impact
  • The issue is not solved at the root level.
  • The corrective action proves ineffective.
  • DV time and cost increase.
How to Avoid It
  1. Perform complete root-cause analysis on failed items.
  2. Develop systemic corrective actions rather than patch fixes.
  3. Run full validation after the correction.
  4. Build a problem knowledge base to avoid repetition.

💡 Greentest solution: Greentest technical teams can support failure analysis and corrective-action design for electrical performance testing projects.

4.9

Reporting and Compliance

Pitfall 27

Test report information is incomplete

Description

The test report lacks required information, causing DV review failure.

Typical Scenarios
  • Missing equipment model or calibration date.
  • Missing DUT identification such as model, batch, hardware version, or software version.
  • Missing environmental condition records.
  • Missing tester authorization, signature, or review records.
  • The referenced standard edition is not stated.
Impact
  • The report does not meet DV requirements.
  • Its validity is challenged during audit.
  • Traceability is weakened.
How to Avoid It
  1. Use a standardized report template.
  2. Check completeness against a pre-release checklist.
  3. Keep equipment calibration records current.
  4. Enforce a strict report review process.

💡 Greentest solution: Reports generated by VectWorks 3.0 can include complete test conditions, equipment information, and curve data, with customizable templates.

Pitfall 28

Report data does not match source data

Description

The values shown in the report are inconsistent with the original test data, so the result cannot be traced reliably.

Typical Scenarios
  • The wrong waveform screenshot is inserted.
  • Different rounding rules are applied.
  • Test date and report date do not match clearly.
  • The wrong standard edition is referenced for the limit line.
Impact
  • Traceability becomes difficult.
  • The OEM questions the data integrity.
  • Compliance risk increases.
How to Avoid It
  1. Ensure every report value maps to source data.
  2. Create a data cross-check process.
  3. Use automated report generation where possible.
  4. Review the report against raw data before release.

💡 Greentest solution: VectWorks 3.0 links generated reports to raw data files for two-way traceability and lower reporting risk.

Pitfall 29

Deviation from the standard is not declared

Description

The actual test method deviates from the standard, but the report does not state that deviation clearly.

Typical Scenarios
  • An equivalent test condition is used without explanation.
  • The equipment model differs from the recommended setup.
  • The sequence differs from the standard method.
  • Some items are skipped because of equipment limitations but not declared.
Impact
  • The OEM may reject the deviation.
  • Supplementary testing or retesting may be required.
  • The DV result may be affected.
How to Avoid It
  1. Record every deviation and explain the reason.
  2. Assess the impact of the deviation on result validity.
  3. Confirm the deviation with the OEM if necessary.
  4. Mark the deviation explicitly in the report.

💡 Greentest solution: VectWorks 3.0 supports method-deviation recording and can include deviation notes and impact assessment in the generated report.

🏢 Greentest Electrical Performance Testing Solutions

Greentest in One Sentence

Guided by the idea of being an engineer's testing steward, Greentest provides integrated solutions across electrical performance test systems, EMC test systems, automation platforms, and laboratory planning and construction.

ItemInformation
Company NameGuangzhou Greentest Electronics Technology Co., Ltd.
BrandGreentest
FoundedNovember 2015
PositioningFocused on electrical performance and EMC test solutions
QualificationsNational high-tech enterprise and specialized innovative SME
ConceptEngineer-oriented testing stewardship
Core Product

VectWorks 3.0 Electrical Performance Test Software

Product Positioning

Software for simulating vehicle start events, superimposed ripple, open-circuit conditions, and other electrical system changes under automotive operating conditions.

Supported Standards (customizable)
  • ISO 16750-2:2023
  • VW 80000:2022
  • MBN LV 124-1:2013
  • MBN LV 148:2013
  • ISO 21780:2020
  • GB/T 45120-2024
  • and more
Core Functions
  • 🔧 One-click parameter setup and standard execution
  • 📊 Real-time Upp and Ipp ripple monitoring
  • 🔁 Supports closed-loop or open-loop testing
  • ⚙️ Supports closed-loop or open-loop testing
  • 🔋 Supports bipolar power supply or power amplifier architecture
  • 📶 Supports narrowband measurement with FFT
  • 🔌 Combined control of multiple instruments
  • 📈 Visual interface
  • 🔄 Multi-standard switching
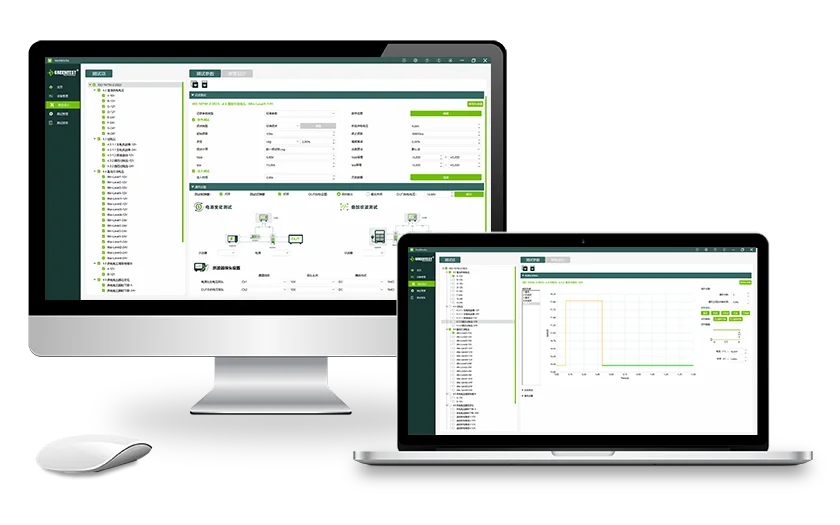
VectWorks 3.0 electrical performance test software
Core Product

PTS Electrical Performance Test System Series

System Composition

PTS power system plus VectWorks host software plus oscilloscope plus optional modules.

Core Features
  • 🏗️ Highly integrated design
  • 💻 Hardware-software integration
  • 🔄 Multi-standard compatibility
  • 📐 Easy expansion
Advantages
  • Low ripple noise, including dedicated ripple models down to 20 mVpp
  • Fast rise time, typically 10 us or below
  • Programmable equivalent internal resistance
  • Overvoltage, overcurrent, and overtemperature protection
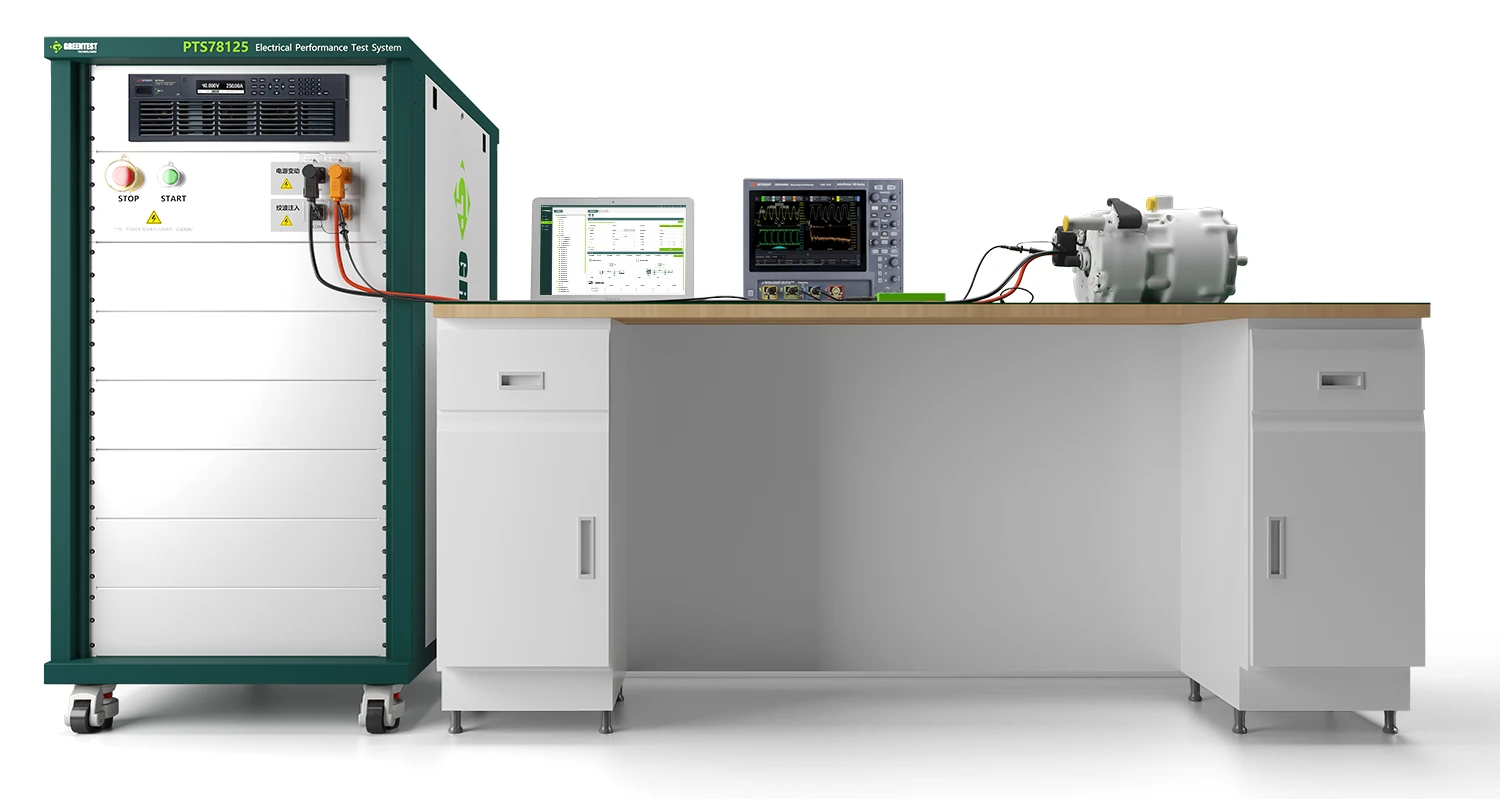
PTS electrical performance test system
Core Product

GtestWorks Automation Test Platform

Core Capabilities
  • Multi-module coordinated control
  • Multi-standard switching and execution
  • Automated closed-loop testing
  • Chamber coordination
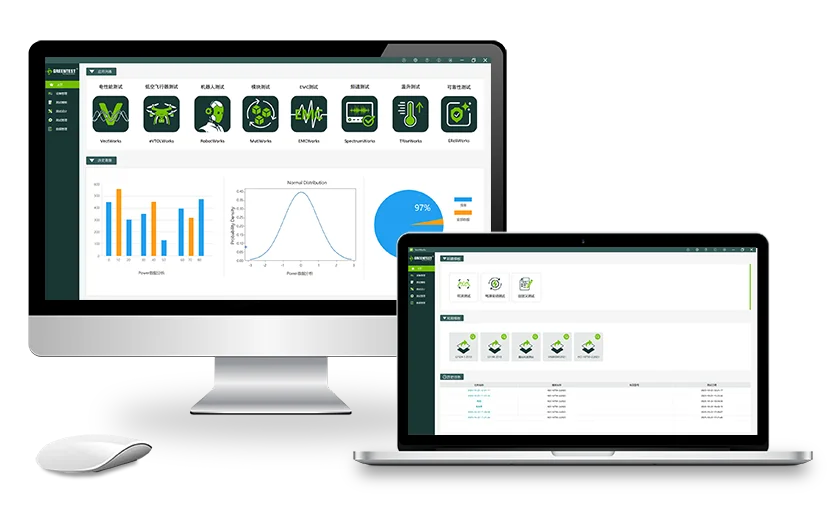
GtestWorks automation test platform
Core Product

SCP Flexible Current Probe Series

Application

Current measurement.

Features
  • Flexible form factor for easier routing
  • Bandwidth covering DC to 30 MHz
  • Suitable for large-current measurement
DimensionTypical Pain Point in Traditional SetupsGreentest Advantage
Standard CoverageStandards update slowly and parameters must be checked manuallyVectWorks includes multiple standards and switches parameters automatically
Equipment CoordinationMultiple devices must be configured separatelyPTS systems provide integrated coordination between hardware and software
EfficiencyManual operation is time-consuming and error-proneAutomated test workflows enable one-click execution
Data ManagementData is scattered and report creation is slowReports are generated automatically and remain traceable
Ripple TestingNoise floor is too high and verification is complicatedLow-noise source capability, one-click verification, and FFT-based narrowband support
Technical SupportUsers have to debug everything themselvesDedicated technical teams support implementation and troubleshooting

Why Greentest

  • Focused: Deep involvement in automotive electrical performance testing.
  • Compliant: Product capabilities align with major domestic and international standards.
  • Efficient: Integrated hardware and software improves test throughput.
  • Reliable: Protection mechanisms improve safety during demanding tests.
  • Easy to Use: Visual workflow lowers the operating threshold.
  • Supported: Professional technical teams provide timely support.

📝 Conclusion

Electrical performance testing for low-voltage automotive components is a systems-level engineering activity. It depends on standard interpretation, equipment selection, environmental setup, waveform generation, and data acquisition working together correctly. The nearly 30 pitfalls summarized here come from real engineering experience and highlight the places where projects most often lose time, accuracy, and confidence.

We hope this report helps teams:

  1. Avoid pitfalls: Understand frequent issues and prevent them early.
  2. Improve efficiency: Use the right method from the start and reduce rework.
  3. Stay compliant: Meet standard and customer requirements more smoothly during DV.

If you encounter any difficulty during testing, the Greentest technical team can provide support. The goal is not only to offer products, but also to become a trustworthy technical partner for your engineering team.

Document Information

  • Version: V1.0
  • Prepared by: Greentest
  • Year: 2026
  • For specific requirements, always follow customer standards and the OEM-approved organization.

This report is based on general engineering experience in automotive electrical performance testing. Actual acceptance criteria should always be determined by the target customer standard and the OEM-approved validation body.

Explore Sales, Technical & Solution Resources?

Contact Us
Tel: 020-2204 2442
E-mail:Sales@greentest.com.cn
微信客服二维码